There is no doubt, to run projects successfully you should collect data and track all the changes. But what’s even more important than data collecting, are the possibilities to analyze and share results. Therefore, in today’s article, we will talk about Power BI – one of the best Microsoft apps to run reports and surface insights. In addition, we will discuss Power BI with Microsoft Teams and will see how you can use both tools to improve your collaborative way of work.
What is Microsoft Power BI?

Microsoft Power BI is an assortment of cloud-based services that help your organization collect, manage, and analyze data from a variety of sources.
Thus, with Power BI you can get insights from your data and to analyze how is your business is performing and to make decisions on apps performance.
Power BI is based on AI technologies and can be used for a multitude of purposes:
- Power BI pulls data together and processes it, using visually compelling and easy-to-process charts and graphs;
- It connects to a range of data sources from Excel to your own cloud-based apps or Web sources;
- This software is available as a Windows desktop application called Power BI Desktop, an online service called Power BI, and mobile Power BI apps that are available on any phones or tablets.
What do you use Power BI for?
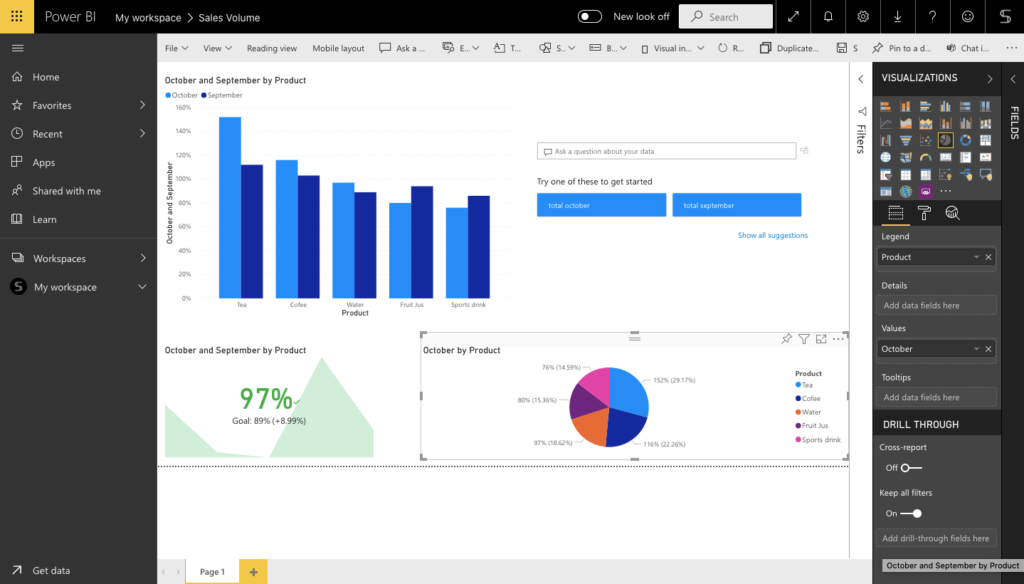
Data Exporting
We know that in your workspace you store and collect tons of data. This can be the result of your sales, financial reports, data from investment projects, and so on. Power BI is a cloud-based space where you can collect and store data across your entire organization. You can rest assured that storage is secure – this software protects your data using the latest technologies.
Building Reports
Collecting data is a must for every organization. But it is even more important to be able to work with data. With power BI, you can not only store information in a safe place but also easily analyze it. With artificial intelligence technology, you can build graphs, dashboards, charts, and more.
Data visualization helps you react quickly to any changes in real-time. What’s important here, you can export data for reports not only from your files on your personal computer. You can also export them from any sources used by your organization or even from web pages. Explore Power BI training according to your needs and learn how to get the most out of your organization’s dashboards and reports.
Sharing with colleagues
You can easily share reports with your colleagues in Office 365. This is convenient for collaborative work across the organization. Leave comments, send emails, or even upload your report to your own site and share the link.
Making decisions
Why do you ultimately need all the generated reports? Of course, you need to make different decisions every day. Power BI can help you mitigate risks and perform strategic planning. With the help of artificial intelligence, you can easily predict market trends, adapt to any changes, and quickly make the right decisions.
Power BI integration
One more advantage of using Power BI is the ability to integrate it with other Microsoft products. Upload your data from Excel sheets or other documents storing in the SharePoint Library. Explore other business management tools such as Dynamic 365 or Microsoft Teams (link to the paragraph on this page) to try useful collaboration and keep your workspace structured. This works also with third-party products like Spark, Hadoop, Google Analytics, SAP, Salesforce, and Mail Chimp.
How to use Power BI?
Let’s see in detail how you can build your own report using Power BI.
Download Power BI
You can get Power BI for free in a few seconds. The first way is to find Power BI App in Microsoft Store and download it on your PC. You can also use it online in your Office 365 environment. Click on the Power BI icon and start using it. Don’t forget that you can use Power BI on your mobile phone to stay up-to-date even outside the office.

Get Data
To build your first Dashboard you should choose the data for analysis. You can upload data from Excel files right from your PC or SharePoint Library. But there is something else.
Additionally, you can export data from apps. Thus, you can use your organizational apps or explore Templates apps, for example, Dynamic 365, Azure DevOps, and much more.
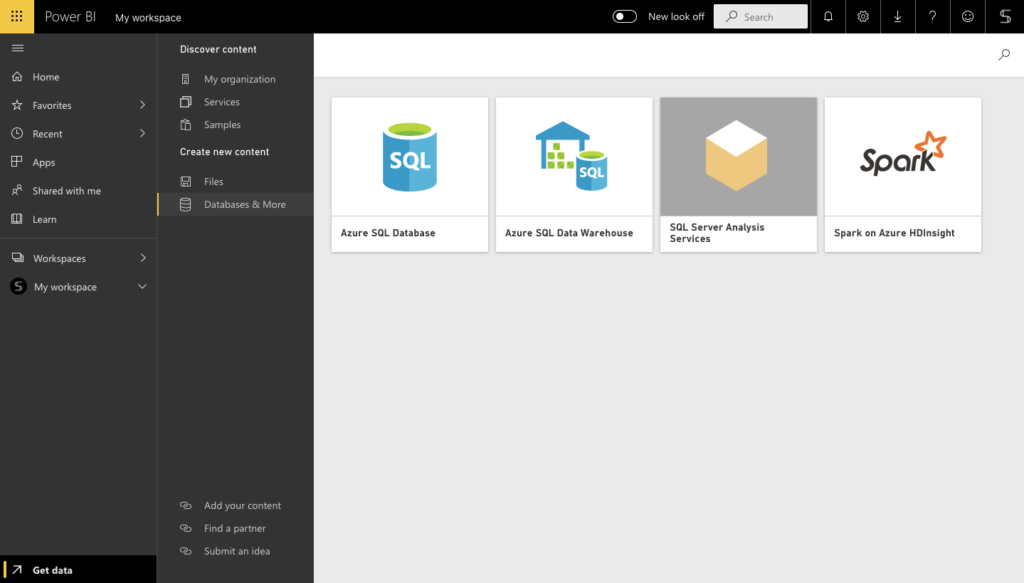
Use pre-built databases like Azure SQL Data or SQL Server Analysis Services. In addition, you can even export data from web pages.
Let’s look at the possibilities of Power BI using the example of exporting data from a regular Excel spreadsheet.
Building a Report
After selecting and filtering the data, you can export it to Power BI. In the beginning, you will see the page with a big blank area, and you can start creating all your visuals like charts, tables, or maps. All of them will go placed in this space.
On the right side, you will see all the fields that you imported from your data. In our example, fields are: Country, Sales, Revenues, and Date – all our columns appear. Basically, it’s all the data that you added and now you can build visuals.
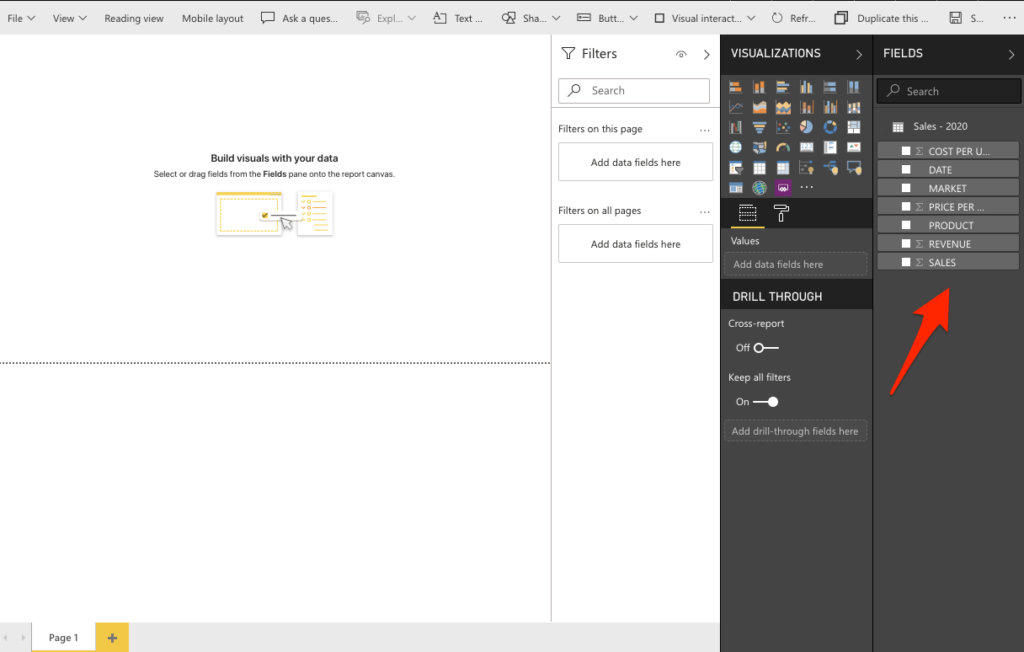
Right of the left of that, there’s another pane called Visualizations. There are different types of visuals you can build using the data from Fields.
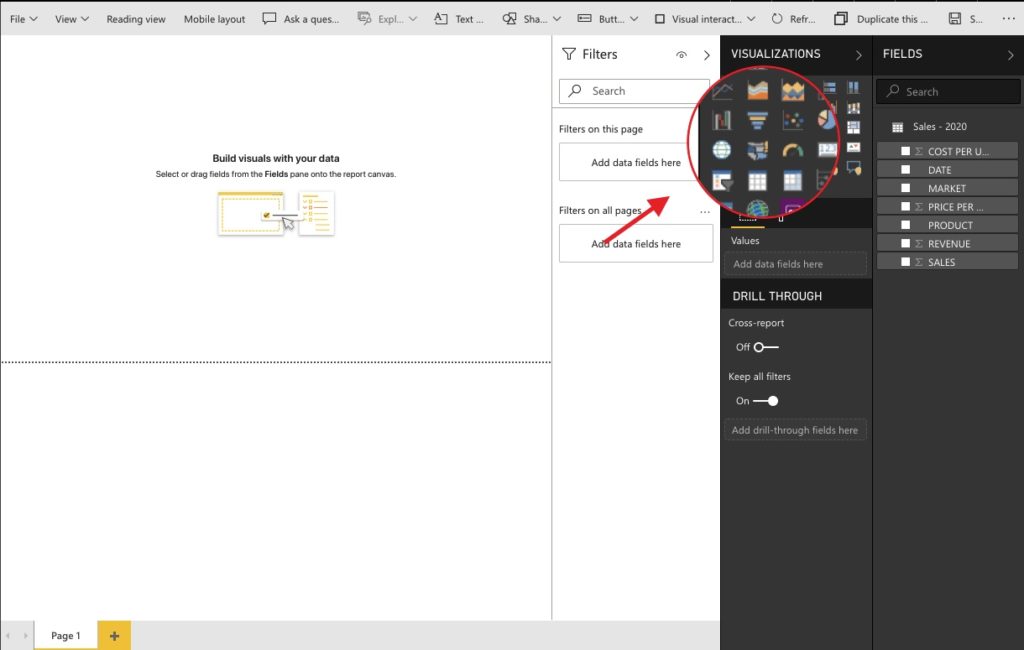
Let’s try to build some visualizations to help you make decisions based on your business data.
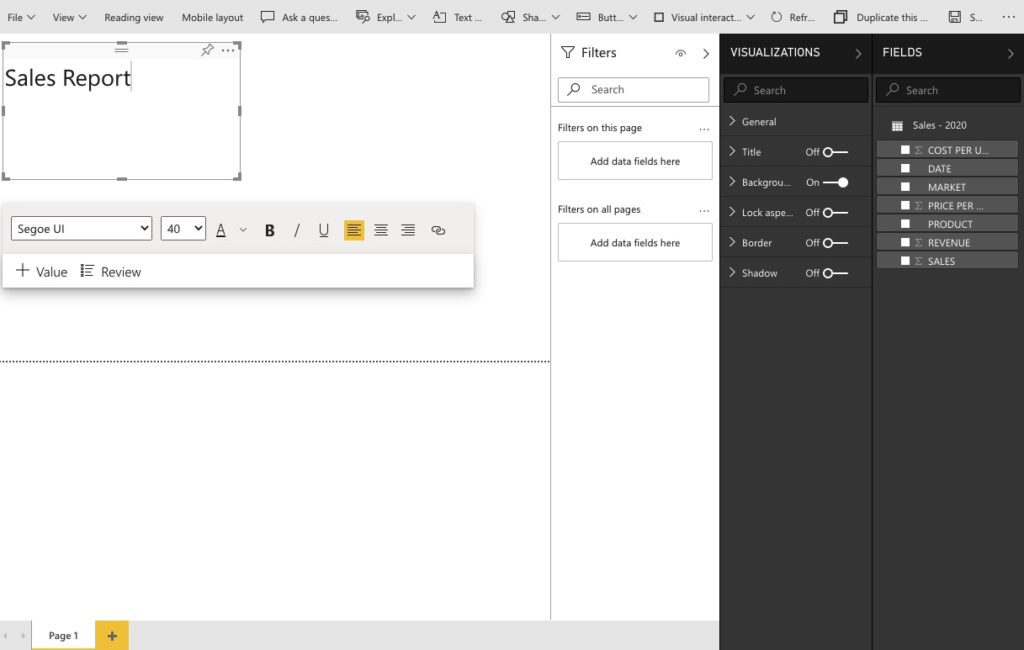
Firstly, let’s type the title of the report using Text Box to give context when people look at this report.
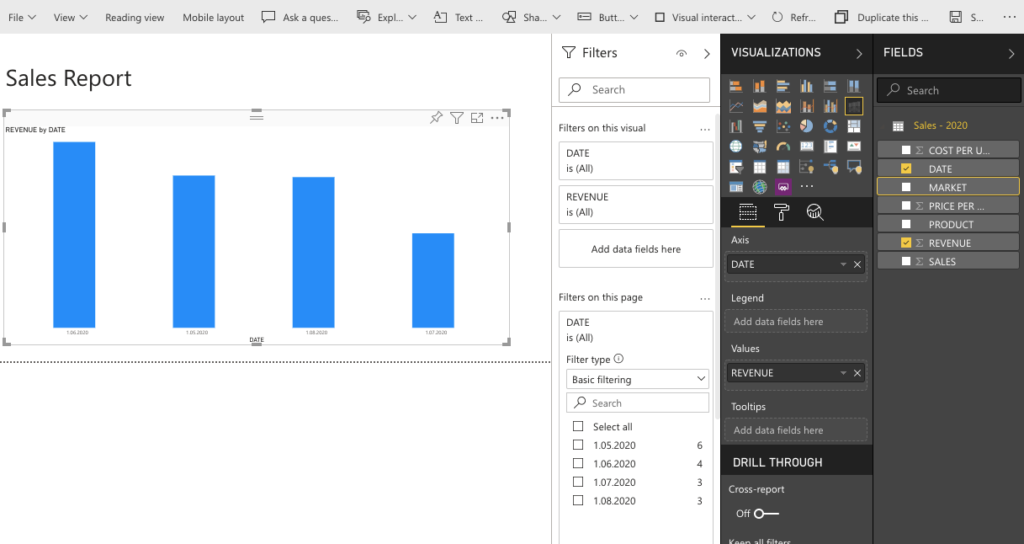
Next, we would like to understand what our profit by date was. We will choose in the fields pane these indexes. Let’s choose the profit and Date and Power BI will automatically convert it into a bar chart. However, you can change it if it doesn’t align exactly with what you want to create. When you hover over the item, you’ll see a tooltip that shows the exact value.
Visualizations
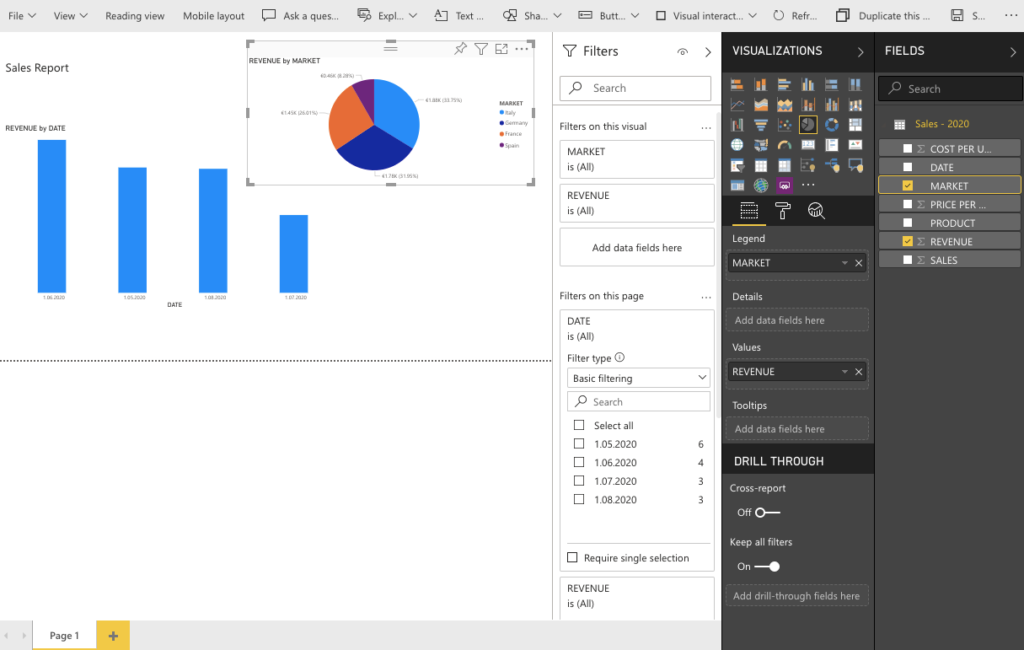
When we look over at visualizations, you’ll see a few other things. Now let’s say we want to see all the geographies where we have activities, and we want to analyze our profit by those geographies. For that, just choose the right data that contains countries in the fields and the map visualization. Now you’ll see the dots where you have your locations. Click on profit and drag it over the map. As a result, you will see visuals that represent how much profit you have by country.
To structure your space let’s add the table view and add there the needed columns. You can even add there the calculations.
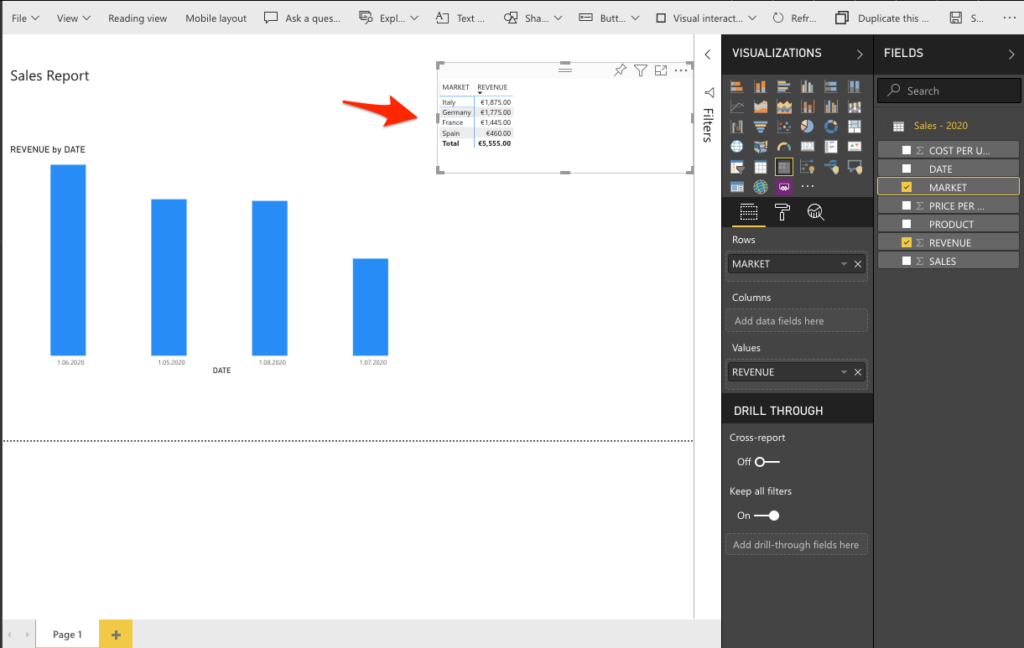
Just like that, you can add many different Visuals to personalize your Reports. In addition, it’s also easy to slice the data right in your report. For that, bring in the Slicer and drag and drop the Data about Countries on the slicer. As a result, if you just want to view data for France, you can click on it and see that all the visuals adjust to reflect that country.
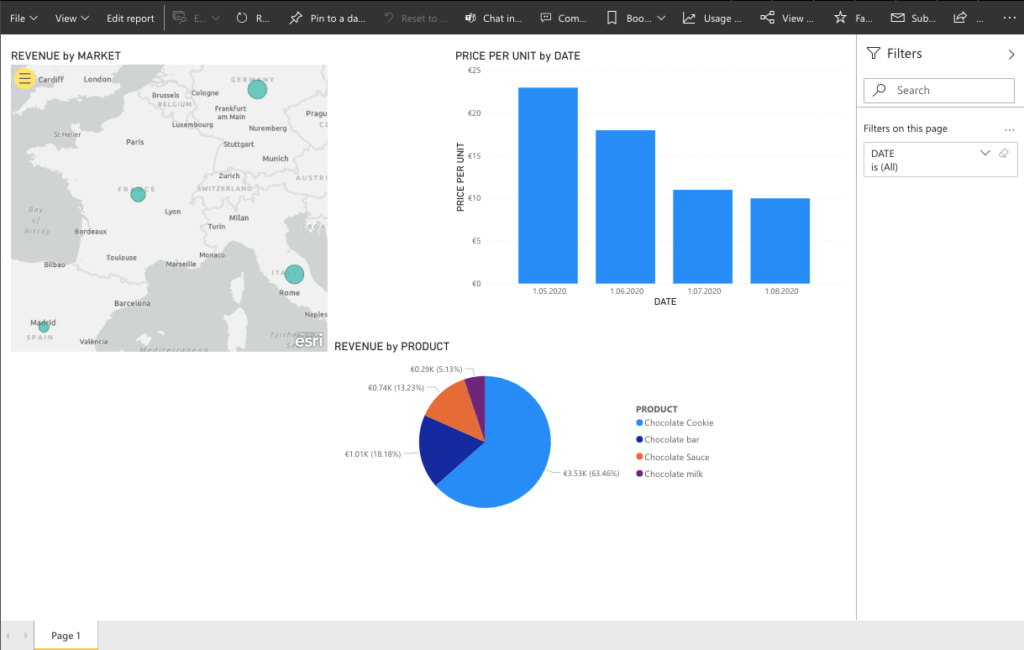
In the end, you can add more pages to your report. Once you’ve done making all your edits, you should save it into the Power BI environment or on your computer.
Sharing with Colleagues
You’re able to easily share your reports with other people. They will be able to see your reports and interact with the different views that you created. To share the report with others you need to publish it to Power BI. It will be published on the Power BI Site.
Thus, if you want other people to come in and to see your visuals you can share it using the report link. Don’t forget to set up the different levels of access. By default, other people will be able to share your report or add new content, but you can easily change it
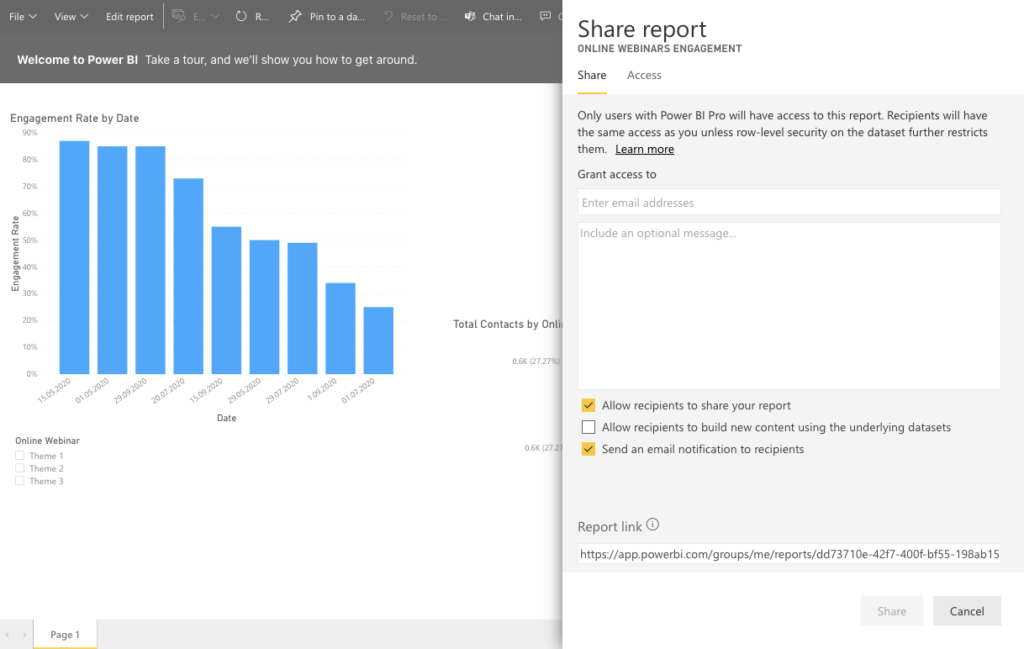
Power BI with Microsoft Teams
As we said earlier, one of the advantages of Power BI is the ability to integrate it with other applications. Let’s have a look at the Microsoft Teams and Power BI integration.
With this integration, you can easily add any report from your Power BI workspace directly to the Teams tab. This allows your team members to keep track of any changes in your organization without leaving their Teams environment.
Implementing reports will not only reduce your time and eliminate the need to jump from one software to another. In addition, this allows your colleagues to quickly track your metrics in real-time. It’s so convenient to make decisions with visuals instead of manually analyzing huge amounts of data. Let’s look in detail at what can you perform with Power BI and Microsoft Teams.
Add the Power BI app to Microsoft Teams
If you click on +More added apps, you will find all available apps stored in Microsoft Store. Just find the Power BI app and add it to your Teams environment. Thus, you will get the full Power BI service lived inside Microsoft Teams.
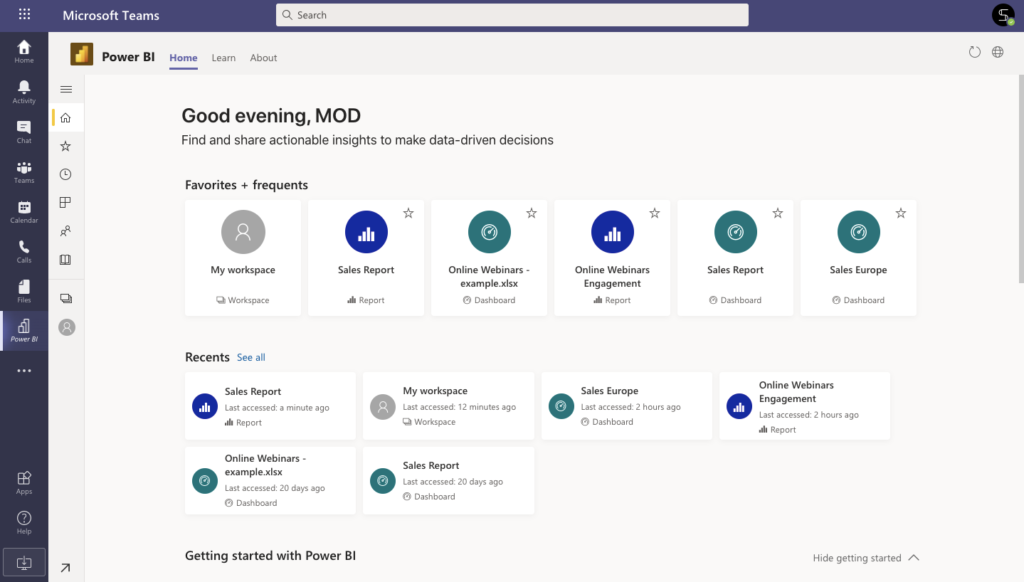
Interacting with your content in Teams is the same as in Power BI. You can easily create dashboards, reports, and workspaces. You can also share your reports with your colleagues in Teams environment through Team Channels
Share Reports with Channel Tab in Microsoft Teams
You can not only add the Power BI app but also embed a report in Teams Tabs. Just click on +new Tab in a needed channel and search for Power BI.
Next, you will need to choose the right report from your Workspace and click on Save
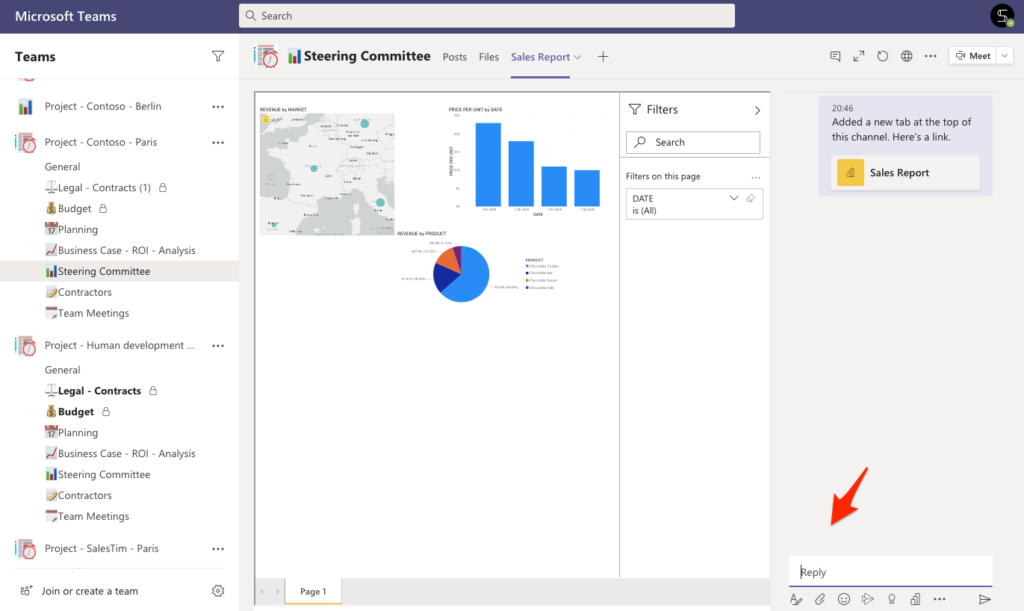
After the report was published, you can easily start a new conversation around a particular report. Thus, your colleagues will be able to communicate on your company results, share ideas for improvement, and even set up the meetings right in Tab Conversation.
Share reports to Microsoft Teams from Power BI
One more advantage is the ability to share your reports and dashboards to Teams right from Power BI. When you finished the editing of a new report, just click on Share in Teams.
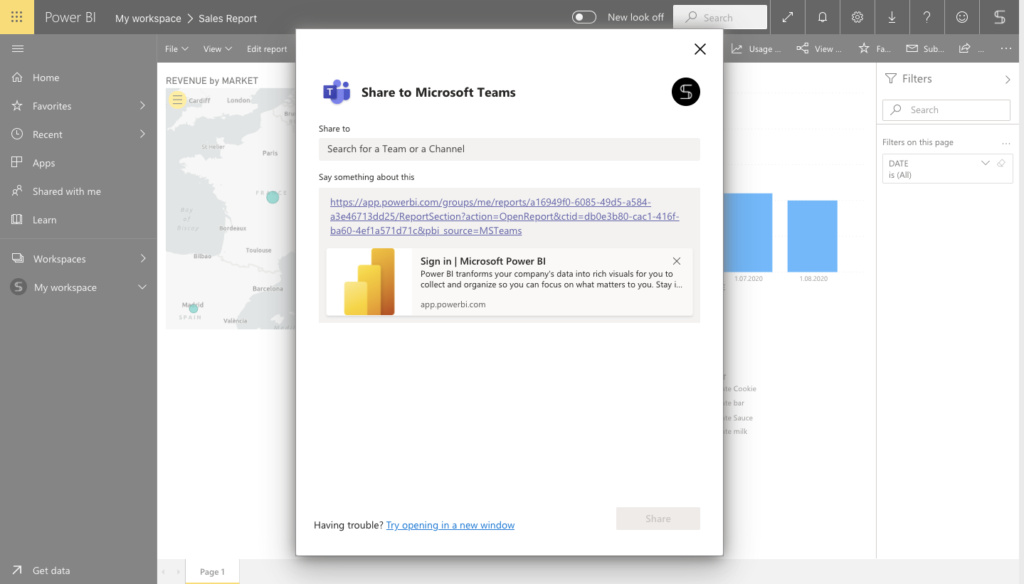
Next, choose the cannel or people you want to send the link to. You can even enter a message to clarify the content. This link will be added to existing conversations or a new chat.
Power BI with Microsoft Teams – use cases
Let’s look at the possibilities using the example of real cases.
Project management
We know that when implementing projects, the key task is to achieve the set KPI. These can be financial indicators, reports on correct decisions and losses, time indicators, market predictions, and much more. It all depends on your case and the purpose of your project.
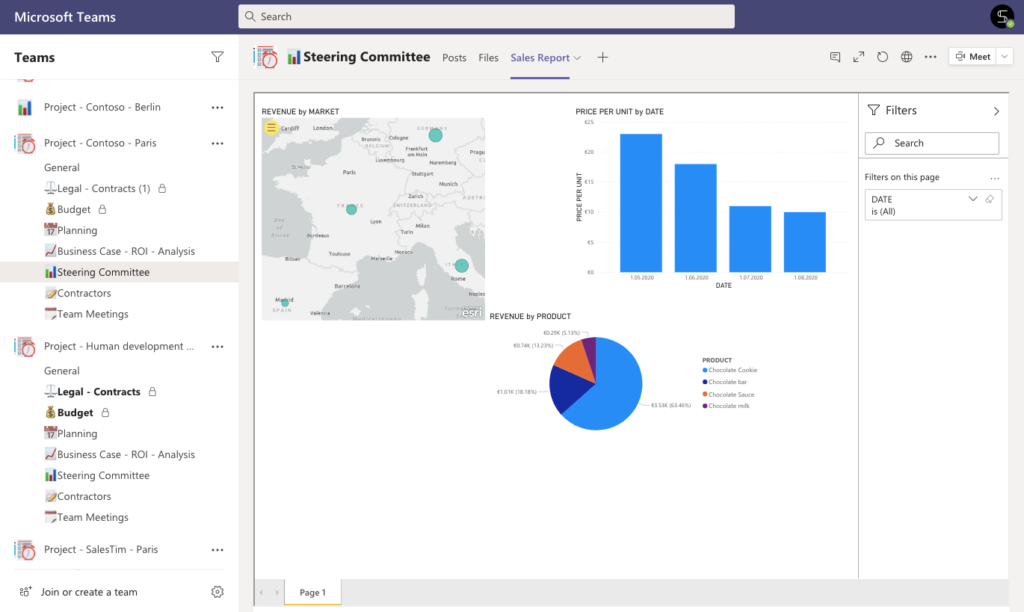
As a project manager, you must track the dynamics of the project and quickly respond to negative indicators. So, with the help of Power BI and Microsoft Teams integration, you can add a report to one of the tabs in your team and track the dynamics of project indicators in real-time.
It is very important that all the stakeholders are aware of project changes. This will allow them to stay focused on priority metrics and quickly schedule meetings and build conversations around weaknesses. So, by using both apps, you can achieve efficiency improvements and set up work in a collaborative way.
Learn more about Microsoft Teams for Project Management.
Marketing team
Let’s say you have an online marketing team. Traffic metrics, new web site visitors, and leads are key metrics for your marketing team to function.
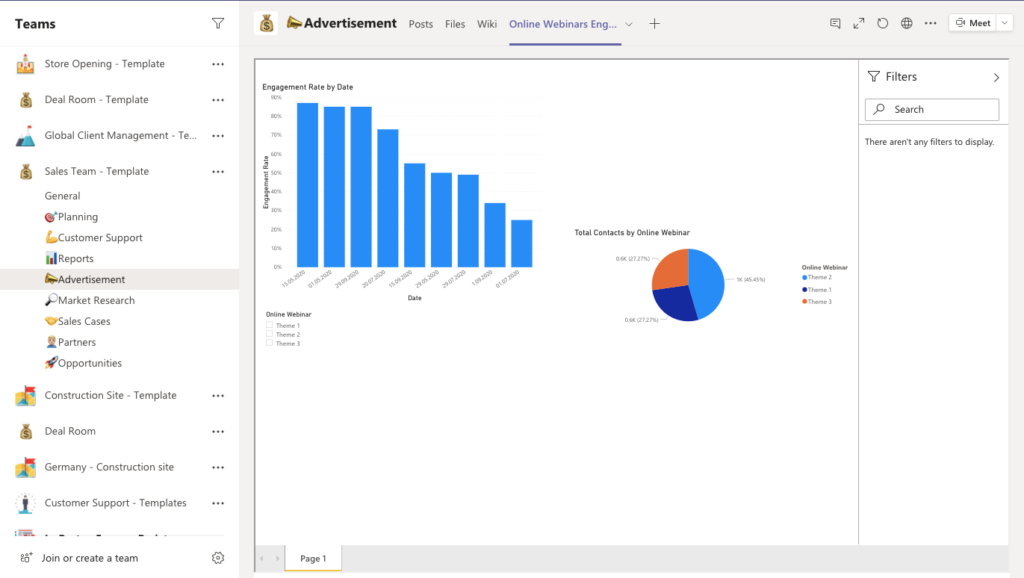
Imagine how convenient it is to keep track of changes without leaving the Teams workspace, where colleagues actively exchange ideas and content. To do this, just build a report based on the data from your Google Analytics account and add it to the Teams tab.
Done! Your colleagues track traffic dynamics and marketing campaigns in real-time
Sales management
Of course, no sales process goes without analysis and market predictions.
Just add your sales activity data to Power BI. With this, you can easily predict the dynamics of market development. By adding these reports to a tab in Teams, your sales team can work more efficiently with procurement and suppliers while avoiding product shortages or surpluses.

Would you like to know more?
Download free Microsoft Teams Use Case Catalog
4 steps to effective use of Microsoft Teams
Power BI with Microsoft Teams Templates
You may wonder about the ways to improve your productivity and reduce the number of manual tasks. Do you know that Microsoft Teams announced the possibility to create Teams Templates with pre-built Channels? It allows you to build a structured workspace in a few seconds. But we know how to improve your Teams experience even more!
Imagine, that you’re able to create the Teams Templates with copied channels, members, settings, files, and Apps. Sounds interesting?
According to our conversation about Power BI, you can imagine how great it would be to have a ready-to-use template with Power BI Dashboard Tab included. Thus, you can build a report with exported data and add it to your Teams Template only once.
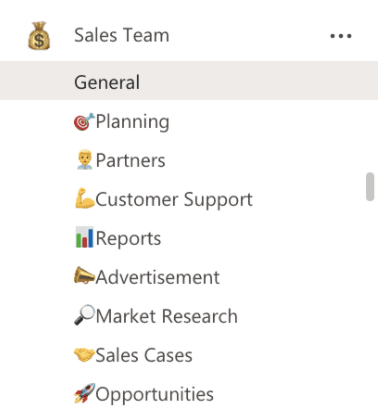
Let’s look on the example of Sales Deal Room Template.
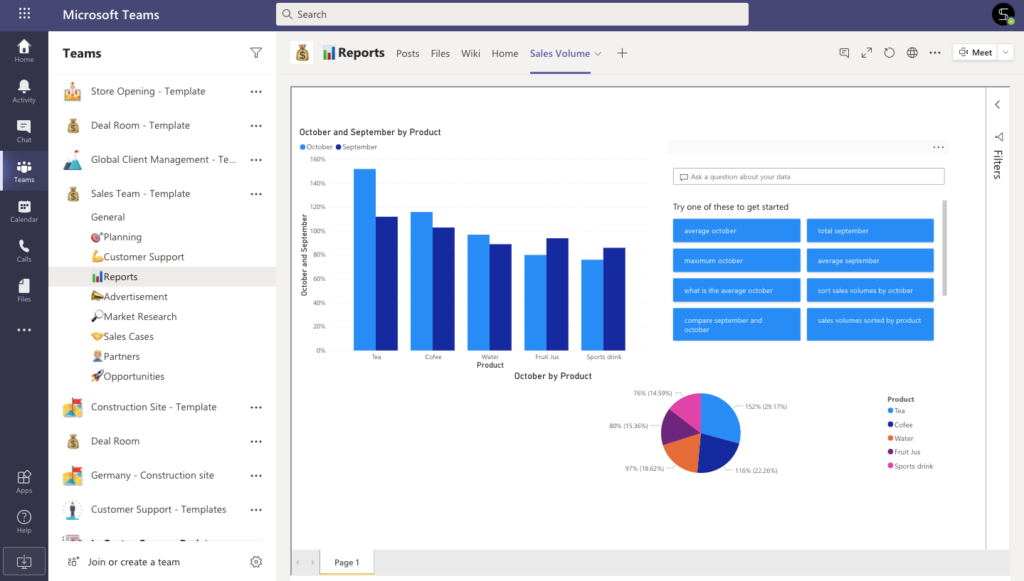
Alright, you created the Original Team with business channels. In addition, you have a Power BI report, that shows your revenue in real-time when someone changes the data in your Data Base. Just add this report to your channel Tab. It allows your sales reps to understand the market conditions in one structured workspace.
The next step will be to create a Teams Template from your Original Team and set up Teams Governance Policies.
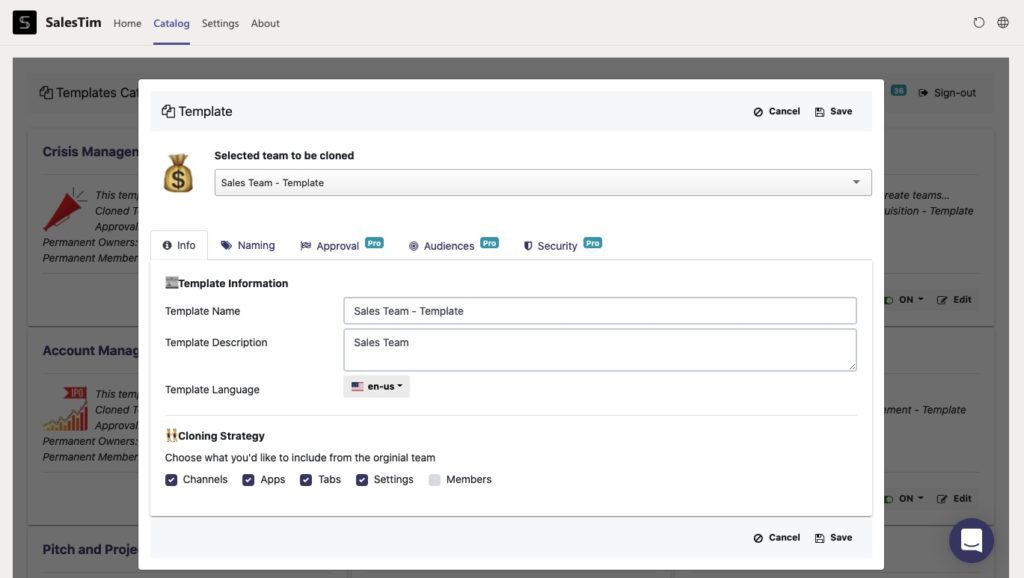
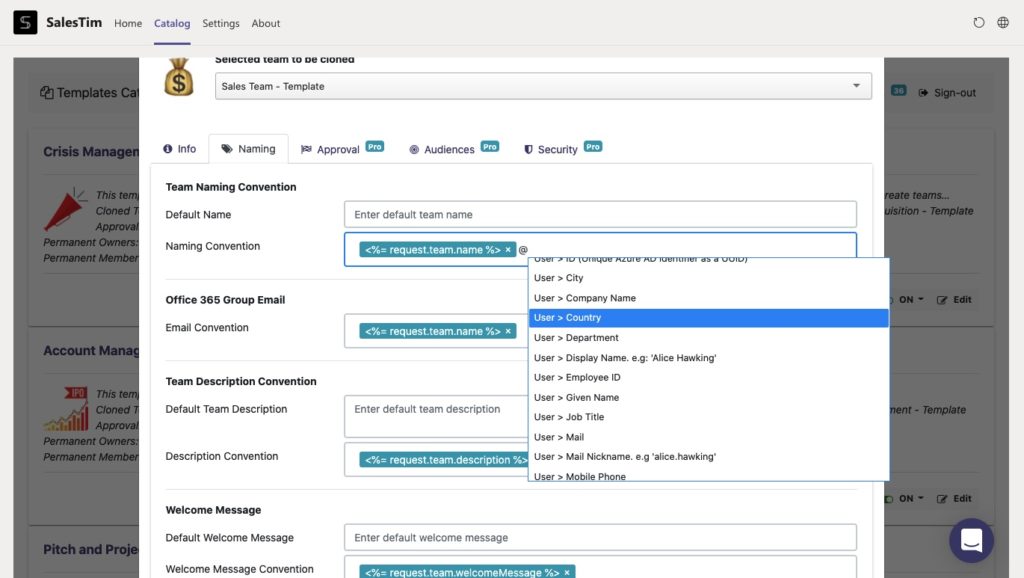
Naming Convention, Approval Workflows, Permanent Membership, and more – everything to empower your Teams Governance.
At the final stage, your end-users will be able to create a new team in a one-click right from your Template Catalog.
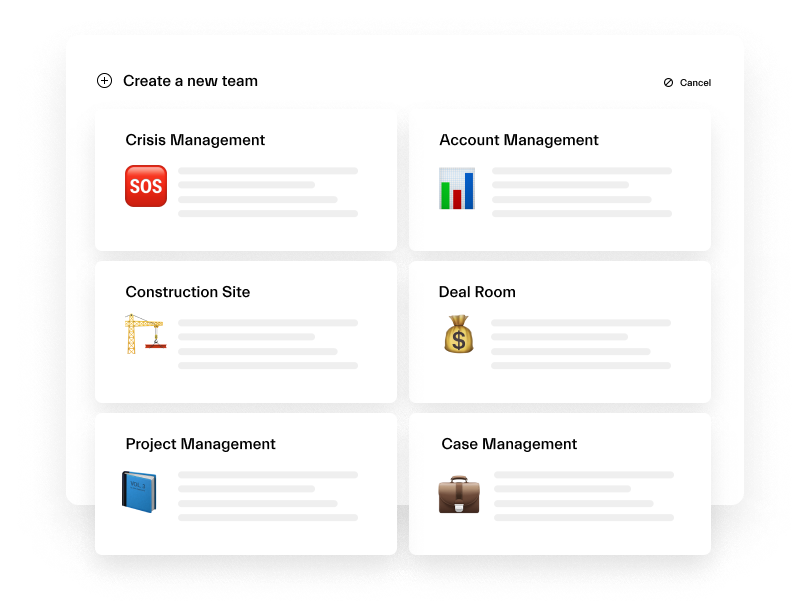
As a result, they will get a fully provisioned team with copied Channels, Tabs, Files, and Settings. And yes, your Power BI Report is already there!
Would you like to try to build your first Teams Template with Copied Power BI Report? We know how to do it!
