If your organization is running Microsoft Teams, you might want to understand how your users are using the tool, what’s their experience like, whether there are certain gaps in understanding the app, and so on. To have a clearer picture of how Microsoft Teams is used in your company you will need to resort to Microsoft Teams analytics tools.
In this article we will share with you why it’s important to analyze Microsoft Teams usage, what exactly you need to measure and how to do it using different analytics tools.
Why do you need Microsoft Teams analytics?
How’s adoption going?
Analyzing user behavior goes hand in hand with adoption of any tool that changes the way people work in the organization. Developing an Adoption Strategy and planning every step of the deployment is extremely important. But things might not go according to the plan: your users might not use Microsoft Teams the way you intended them to, and they may even find a better use for it – one you haven’t considered.
This is why you need to understand usage patterns and trends from the very beginning of the roll-out. This way, you can adapt Teams Adaption Strategy to your audience, make changes in the communication and training plans and reevaluate use cases.
Was the investment worth it?
Microsoft Teams analytics can also help you see if the investment in Teams adoption payed off. There are numerous success criteria that you can apply to measure that – we outline them in detail in this article.
For example, you can analyze internally whether Teams meetings helped reduce phone bills and travel costs. Also, you can analyze how the number of sick leaves changed ever since your organization started operating remotely with Teams. See how the usage of other apps decreased: perhaps your organization can save money on subscriptions.
Having this data will allow you to understand the value of Teams, and sharing that with the executive board will help get more active support from their side.
What should be measured and how?
Now that we highlighted the main reasons why your organization has to analyze how Teams is used internally, let’s figure out what exactly you want to know and what tools can help you get this information.
1. Activity of different departments
The first thing you want to know is how actively employees from different departments are using Teams. You can evaluate the total number of active users per department, invited guests, messages and active channels.
This information will allow you to see if users use teams channels for communication or prefer private chats instead. If the latter, you might want to review your use cases as the main conversations among users go outside of the channels set up for this purpose.
Also, you can leverage this information to see if people from certain departments require additional training for support to further embrace Teams.
You can get Teams usage report in Microsoft Teams admin center. To view it, you must be a global admin in Microsoft 365 or Office 365, Teams service admin, or Skype for Business admin.

You can also find most and least active areas of the organization using Teams with a third-party tool Swoop Analytics.
2. Most engaged teams
Different teams will have different pace of adopting the tool, and you may want to monitor the most engaged ones to understand their success.
By seeing which teams are more successful in their collaboration through Teams you will know exactly where to get your insights and feedback. Analyze their usage, pick up best practices and spread them around the organization to create a buzz around Teams.
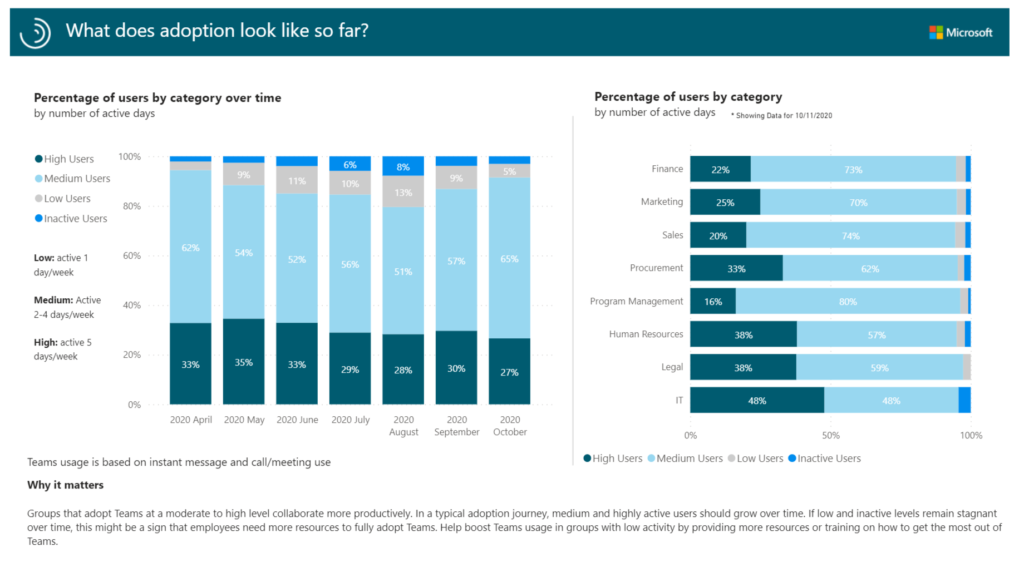
Power BI Teams insights dashboard provide detailed information about the level of activity of different teams and the evolution of user activity over time.
Power BI dashboard is a part of the Workplace Analytics tool and requires additional license. You can read more about the service here.

You can also get this report through Tryane and Swoop Analytics.
Users can also view cross-team analytics of all the teams they are members or owners of right in Teams app, at the bottom of the teams list. Next to Join or create a team, click Manage teams and then Analytics.

3. Top Teams users
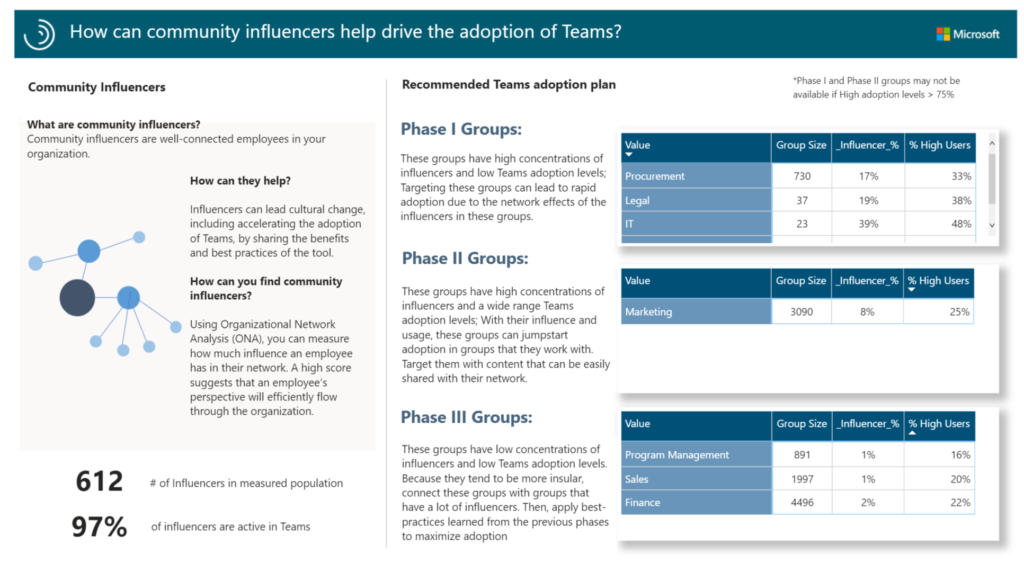
Creating a Champions network is one of the key steps of the Teams adoption. Champions are the most active Teams users in your organization. You can leverage their knowledge and enthusiasm to encourage peer learning. Champions can help their fellow colleagues better understand Teams and their use cases and thus increase users buy-in.
Additionally, you can find Community Influencers – well-connected employees that can lead the change and accelerate adoption.
You can get this information using Swoop Analytics tool and Power BI Teams dashboard.

4. Inactive teams
After a while some of the teams created by your users become inactive. It might be that projects these team were created for are finished, so the team completed its purpose. Or there’s a high probability that users created multiple test teams that were never used.
To free up your storage space and improve governance, it’s a good idea to identify and archive inactive teams. You can oversee inactive teams through with Swoop Analytics and Tryane.

5. Email usage versus Teams messaging
One of the benefits of Teams is the possibility of quickly and efficiently exchange information with people both inside and outside the organization. Ideally, after Teams deployment your users no longer need to resort to email for internal communication. Now everything can be shared via channel posts, group chats or private conversation. Moreover, your users can co-edit documents, eliminating the need to resend an updated file several times via email.
Decrease in the number of emails will be a sign of successful Teams adoption, which is why it’s important to measure.
You can get this information with Lecko analytics tool.

6. Meeting time
Meetings are an indispensable part of our work life. However, it’s important to make sure that they actually bring value to your staff and do not intervene with their direct responsibilities. Too many or too long meetings impede productivity and create frustration among employees.
Knowing how much time your teams spend in meetings can help you better understand current work practices and support respective changes.
You can get meeting time report with Lecko Analytics.

7. Teams device usage
To ensure Teams truly provides on-the-go communication for your employees, you may consider to review Teams device usage. If the report shows that not many users are using the mobile app, this may indicate that they are not aware of how to install the Teams mobile clients or not familiar with capabilities of the mobile app.
You can check Teams device usage report in Microsoft Teams admin center.

8. Chatting/collaborating/meetings activity
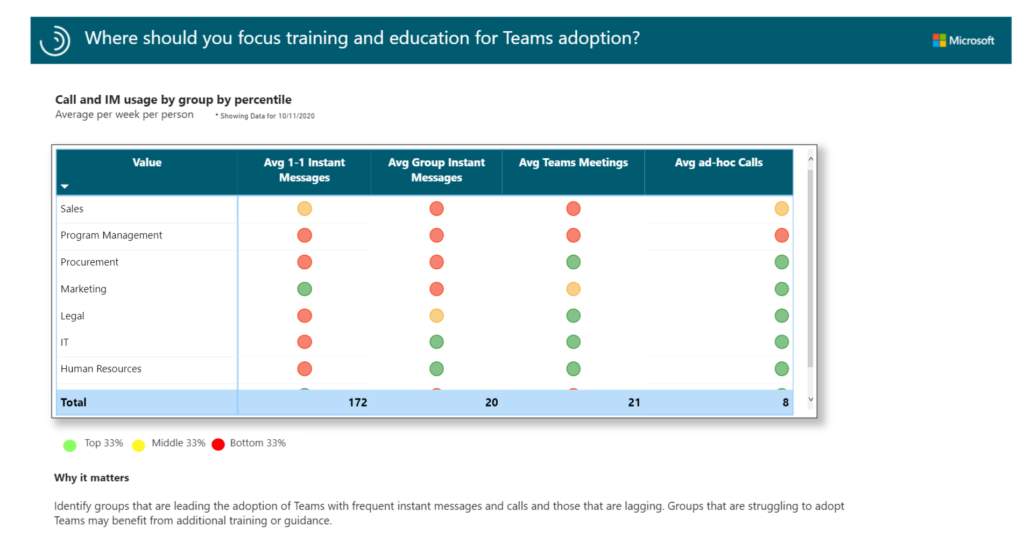
You may want to know who in your organization struggles with adopting Teams and requires additional training.
You can monitor messaging, calling and collaboration activity with Tryane Analytics and with Power BI dashboard.


9. Working after hours
Happy employees are more productive, researchers insist. We all sometimes can’t help but work after hours to deliver in time. However, doing so regularly can drastically affect our health and result in burnout. To thrive at work, we need to take care of ourselves and our team. Which is why it’s vital to monitor employees’ wellbeing, and establish communication guidelines and boundaries, encouraging them to maintain a work-life balance.
With Insights app in Teams, you can monitor various wellbeing indicators, including working after hours. Then, you can respond to irregular rhythms using research-backed recommendations for improvement provided by the app.

You can also get useful insights through Power BI Microsoft Teams insights dashboard.
10. Third-party app usage
To increase your organization’s security, prevent data risks and shadow IT it’s important to monitor third-party app usage across different teams in the organization.
Overseeing most and least used apps can also help you better understand users’ needs and optimize apps subscription types.

There you have it, 10 key criteria to measure with Microsoft Teams analytics tools. By regularly analyzing user activity in your organization, you will be able to adapt the Adoption Strategy to your audience and drive Teams roll-out.
